Amer Alanazi, Mohammed Abounassif, Haitham AlRabiah, Gamal Abdel-Haiz Mostafa
Pharmaceutical Chemistry Department, College of Pharmacy, King Saud University, PO Box 2457, Riyadh11451, Saudi Arabia;For correspondence:- Gamal Mostafa Email:
Received: 15 July 2015 Accepted: 3 April 2016 Published: 27 May 2016
Citation: Alanazi A, Abounassif M, AlRabiah H, Mostafa GA. Development of two charge transfer complex spectrophotometric methods for determination of tofisopam in tablet dosage form. Trop J Pharm Res 2016; 15(5):995-1001 doi: 10.4314/tjpr.v15i5.14
© 2016 The authors.
This is an Open Access article that uses a funding model which does not charge readers or their institutions for access and distributed under the terms of the Creative Commons Attribution License (http://creativecommons.org/licenses/by/4.0) and the Budapest Open Access Initiative (http://www.budapestopenaccessinitiative.org/read), which permit unrestricted use, distribution, and reproduction in any medium, provided the original work is properly credited..
Purpose: To develop a simple, fast and sensitive spectrophotometric method for the determination of tofisopam in tablet dosage form.
Methods: Tofisopam as n-electron donor was reacted with two π-acceptors, namely, chloranilic acid (ChA), and 7,7,8,8 tetracyanoquinodimethane (TCNQ) to form charge transfer complexes. The complexes were evaluated spectrophotometrically at 520 and 824 nm for ChA and TCNQ, respectively. The optimum conditions for the reaction were determined and optimized. The developed method was compared with Japanese Pharmacopeia method.
Results: The calibration curve was linear in the ranges 25 – 125 and 30 – 150 µg/mL for ChA and TCNQ, respectively. The lower limit of detection was 8.0 and 10.0 µg/mL for ChA and TCNQ, respectively while the slope and intercept of the calibration curves were 0.0025 and 0.011 and 0.0115 and -0.237, for ChA and TCNQ, respectively.
Conclusion: The developed methods for tofisopam have good accuracy and precision, and comparable to a standard pharmacopeial method. The methods can be applied for routine analysis and in quality control.
Introduction
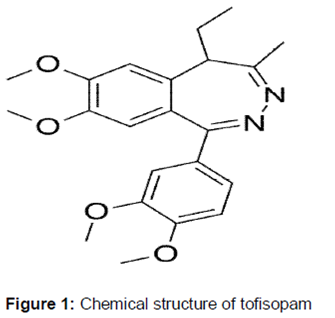
Tofisopam () is a 1, 2-benzodiazepine, but is not analogous with other anxiolytic benzodiazepines which are generally 1,4- or 1,5-substituted. However, tofisopam does not have anticonvulsant, calming [1], skeletal-tension reduction, motor skill-damaging or amnestic [2] effects [3]. It is prescribed for the therapy of worry and alcohol retraction, in a dose of 50 - 300 mg daily divided into three doses. Tofisopam is not indicated as causing dependence to the same extent as other benzodiazepines, but it is still recommended to be used for a maximum of 12 weeks.
The drug is also a PDE10A inhibitor, and has been suggested as a therapy for mental disorder [4]. The pharmacological efficacy of tofisopam and its inherent toxicity has led to the development of different methods for its assay.
Spectrophotometry [5,6], spectrofluorometry [5,7], high performance liquid chromatography (HPLC) using either reverse-phase chromatography [8-10], enantiomeric separation [11,12], gas chromatography (GC) [13,14], and super critical chromatography [15] have been cited in the literature for determination of tofisopam in its dosage form. Although, most of these methods are sensitive, however, their disadvantages include long run times, derivatization procedure and high cost.
Spectrophotometry is a popular technique for analytical analysis, especially, due to the high cost and complexity of most techniques that require sophisticated instruments and a highly trained analyst. However, only two spectrophotometric methods have been reported [5,6]. The first method was based on reduction of ferric into ferrous in the presence of 1,10-phenanthroline to give an orange-red colored ferroin complex that measured at 510 nm [5], while the second method is based on derivative measurement [6].
Charge-transfer complexes [16,17] are based on the interaction between electron donors and acceptors, which are characterized by absorption of radiation in the region of ultra-violet and visible region (200 - 800 nm). Compounds of n-electron donor react rapidly with π-acceptors to form a complex at normal conditions. π-acceptors are used for the development and establishment of spectrophotometric method for the determination of –n-electron donor compounds, especially biologically active pharmaceutical compounds.
The aim of the present investigation was to study the charge transfer reaction between an n-donor (tofisopam) and π-acceptor (ChA and TCNQ) that forms a charge transfer complex. The proposed spectrophotometric methods were tested for the determination of tofisopam in its dosage form.
Methods
Apparatus
A Shimadzu UV-1800, double-beam, ultraviolet-visible spectrophotometer with 1-cm quartz cells was used.
Materials and reagents
Chloranilic acid (ChA), purchased from Merck, Darmstadt, Munich, Germany. A 1 mg/mL solution of tofisopam prepared in acetonitrile. 7, 7, 8, 8-tetracyanoquinodimethane, obtained from Aldrich Chemical Co., Milwaukee, USA. All reagents/solutions were stable for at least 1 week when kept in refrigerator. Pure tofisopam (≥ 98 %) was purchased from Sigma (St. Louis, Mo, USA). The stock solution of tofisopam (500 µg/mL) was prepared by dissolving the exact amount of tofisopam in acetonitrile. Other working solutions were prepared by suitable dilution of stock solution in acetonitrile. Acetonitrile was of analytical reagents grade. Nodeprine tablets (Acapi Pharmaceuticals, Cairo, Egypt), each tablet containing 50 mg of tofisopam were also used in this study.
Determination of tofisopam in its dosage form
Ten tablets were weighed accurately and ground. A quantity of the powder equivalent to 50 mg of TOF was transferred into 100 mL measuring flask and dissolved in acetonitrile in an ultrasonic bath for about 40 min. The solution was filtered through Whatman filter paper no. 41, then the filtrate was transferred into a 100 mL volumetric flask and diluted to the mark with acetonitrile. A suitable aliquot of this solution was transferred into 10 mL volumetric flask, then the unknown concentration of the drug was determined as described in the following section.
Procedure
An appropriate amount of the standard solution of tofisopam was transferred into a 10 ml calibrated flask; one mL of ChA reagent was added. It was made up to volume with acetonitrile and the absorbance at 520 nm. For TCNQ assay technique, a suitable amount of the sample solution of tofisopam was transfer into a test tube, and 1 mL of TCNQ reagent was added, and heated at 70 oC for 20 min in a water bath. The resulting solution was cooled down, transferred into a 10-ml measuring flask and made up to the mark with acetonitrile. The absorbance of the resulting solution was measured at 842 nm. The calibration curve for each method was prepared by plotting absorbance versus concentration of tofisopam.
Validation of the proposed method
Under the optimum reaction situations, the calibration curves for tofisopam were developed for each of the methods. Each concentration was tested five times and the mean absorbance was determined and plotted against concentration. Regression equations of the obtainable data were obtained from the calibration curve.
Limit of quantification (LOQ) and of detection (LOD)
The lower limit of quantification (LOQ) and lower limit of detection (LOD) were evaluated using the least square equation obtained from the calibration curve based on the following equation: y = ax ± b, where y is the absorbance, a the slope, and x the concentration. The exact equation is y = 0.0025x + 0.0115 and y = 0.011x - 0.12373 for ChA and TCNQ, respectively, where y, a, x and r are the absorbance, concentration of TOF and slope, intercept and correlation coefficient, respectively. LOD and LOQ were derived [21] using the equation: LOD or LOQ = K.SD.b/a, where K = 3.3 for LOD and 10 for LOQ, SD is the standard deviation of the intercept, and a is the slope.
Interferences
In order to investigate the effect of commonly encountered compounds (including starch, lactose and glucose) present in tofisopam dosage form on the proposed methods, interferences studies were carried out.
Precision and accuracy of the proposed method
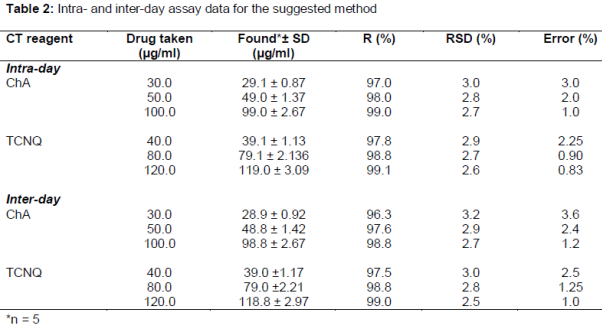
Intra-day and inter-day accuracy, and precision of the proposed methods were assessed by analysis of tofisopam in six replicates during the day and on different days in the limit of quantification range. Precision and accuracy were expressed as relative standard deviation (RSD, %) and recovery (%), respectively. .
Ruggedness
The analysis of tofisopam using two different analysts (operators) and different equipment on different days were carried out to evaluate the ruggedness of the proposed methods.
Robustness
The optimum experimental factors that influence absorbance was examined in order to evaluate the robustness of the proposed methods. The studied parameters were reagent concentration, reaction time, and stability of the resulting complex.
Application of the proposed method
The assay of the drug in a dosage form was compared with that for pure drug to test the reliability of the investigated method.
Results
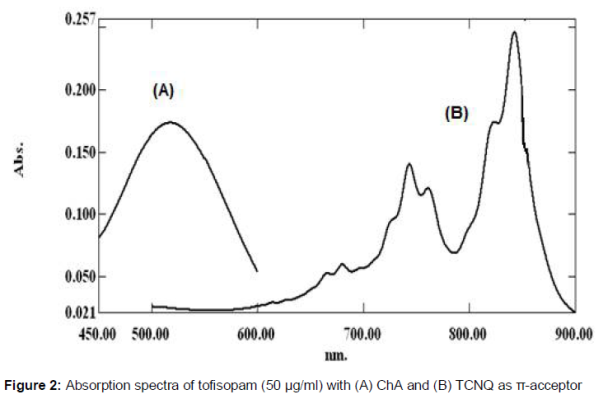
Tofisopam is nitrogenous compound that acted as n-donor which react with the π-acceptors, viz, chloranilic acid (ChA) and 7, 7, 8, 8 tetracyanoquinodimethane (TCNQ) to form charge transfer complexes. The resulting complex exhibited absorption maximum at 520 nm with ChA instantaneously, while the other complex exhibited maximum absorbance at 841 nm (TCNQ) after heating at 70 oC for about 20 min. In case of ChA, the purple color instantaneously formed at room temperature. On the other hand, the complex with TCNQ reagent exhibited a blue color after heating at 70 oC for 20 min. One ml of TCNQ solution was found to be suitable for production of maximum absorbance. The intensity of the product color remained stable for about 1 h.
Effect of reagent concentration
When different volumes of reagent concentration (1 mg/mL, acceptor) were added to a fixed concentration of tofisopam, it was noticed that 1.0 mL of ChA and TCNQ, respectively, was adequate for the production of maximum absorbance. A higher volume of the reagents did not influence the absorbance value. shows the absorption curves of drug with ChA and TCNQ reagents. As a result, in all incoming studding 1 ml of reagent was used.
Effect of reaction time and temperature
The optimum reaction time was monitored by measuring the absorbance at 520 nm for ChA at room temperature (25 oC). It was recorded that color development was instantaneous and the intensity of the resulting color did not change with increase in time interval. On the other hand, for TCNQ, at room temperature, only a faint color appeared and absorbance increased with increasing in time.
Stoichiometry of the reaction
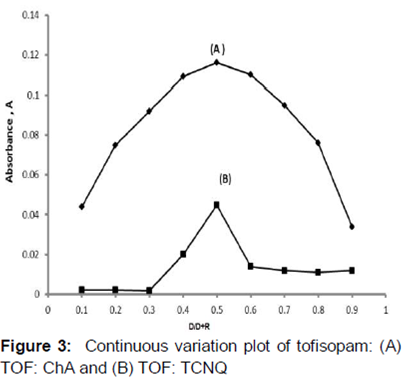
To determine the molar ratio between the drug (n-donor) and the reagent (π-acceptors), Job’s method [18] of continuous variation was employed. Two master equimolar (2.83 × 10⁻⁴ M) solutions of TOF with ChA or TCNQ were prepared. Different portions of the master solutions of TOF and ChA as well as TOF and TCNQ were made in varying ratios (1:9, 2:8, 3:7, …… 9:1), and analyzed. Molar ratio of the reactants (drug: reagent) was determined by continuous variation method (Job’s method) [18] to form charge transfer complex. As shown in , a 1:1 ratio of the drug with ChA and TCNQ was found.
Effect of diluting solvent
The charge transfer reaction was carried out in different solvents for example acetonitrile, acetone, ethanol, water, DMF and DMSO, in order to optimize the most suitable medium for that reaction. Acetonitrile proved to be the most suitable dilution solvent because it afforded superior solvating power for ChA and TCNQ and gave high absorbance intensity. Acetonitrile was thus considered an ideal solvent for the charge transfer reaction offering maximum sensitivity, with its high dielectric constant which raises maximum yield of radical anions, and high solvation power for the acceptors [19].
Validity of the proposed method
LOQ and LOD
LOQ was 25.0 and 30.0 ppm for ChA, and 8.0 and 10.0 ppm for TCNQ. The correlation coefficient (r2) was 0.998 and 0.997 for ChA and TCNQ, respectively.
Interferences
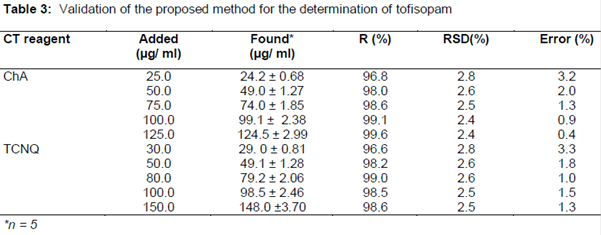
The results in , show a mean range of 96.8 - 99.6 % and 96.6 - 98.6 % for ChA and TCNQ, respectively, indicating that there was no interference from the excipients present in the dosage form.
Precision and accuracy
The results in are within the acceptance range. Intra-day and inter-day precision was 2.7 - 3.0 % and 2.6 - 2.9 % for TOF-ChA, and 2.7 - 3.2 % and 2.5 - 3.0 % for TOF-TCNQ. On the other hand, the accuracy of the proposed methods for intra- and inter-day was 96.3 - 99.0 % and 97.5 - 99.1 % for TOF-ChA and TOF-TCNQ, respectively.
Ruggedness
Relative standard deviation was < 3.3 % for repetitive measurements on different three days and throughout the same day using two different instruments and two operators, thus indicating that the proposed methods are capable of yielding results with a high degree of precision ().
Robustness
RSD was < 3.3 % under different conditions, including reagent concentration, reaction time and stability of the resulting complex. Thus, the results () indicate that the proposed methods are fairly robust.
Applicability
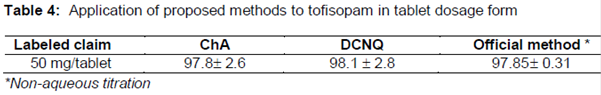
Determinations of tofisopam (n = 5) by the proposed methods gave mean recovery of 96.8 - 99.0 % and 96.6 - 98.6 % with RSD of 2.4 - 2.8 % and 2.5 - 2.8 % for TOF-ChA and TOF-TTCNQ, respectively (). Thus, the method has good accuracy and can be applied for the determination of the drug in its dosage form.
shows the results obtained for the determination of tofisopam in the dosage form using the developed spectrophotometric method compared with the official titrimetric method of Japanese Pharmacopeia method [20] Thus, the proposed methods are comparable with official titrimetric method.
Discussion
The formation of charge transfer complex due to the interaction of n- electron donor (tofisopam) with π-acceptors (ChA, and TCNQ) which s - create a colored charge transfer complexes with low molar absorptivity in non-polar solvent. In contrast, in polar solvents such as acetonitrile, a full electron transfer from tofisopam (D), (n electron donor), to the acceptor moiety (A) (π-acceptors, in this case, ChA and TCNQ) take place with the construct of strong colored radical ions with high molar absorptivity values, according the next equation :
D + A ⇄ (D-A) ⇄ D.+ + A.-
complex radicals ions
Separation of the donor-acceptor complex (D-A) was confirmed by the high degree of ionizing power of the polar solvent acetonitrile [21]. The apparent color complex have different absorption maxima at 520 and 842 nm for ChA and TCNQ respectively. The produced color species with TCNQ in acetonitrile is the bluish-green colored radical anion, showing a strong absorption maxima at three different wavelengths 742, 825, and 842 nm. These bands refer to the formation of the radical anion, TCNQ•-, which perhaps is formed by the separation of an original (donor-acceptor) complex (D-A) between the drug and acceptors.
Conclusion
A spectrophotometric method for the analysis of tofisopam in the dosage form has been constructed. The proposed method is based on the use of ChA and TCNQ as π-acceptors. The assay was completely validated according to the recommended procedure for validation and the results were favorable. The suggested methods are comparably with official titrimetric method, as shown by acceptable recovery values. The proposed methods are simple, economical, fast, accurate, sensitive and suitable for routine quality control of tofisopam in the dosage form without any interference from excipients.
Declarations
Acknowledgement
References
Archives


News Updates